Business Intelligence: Where's the value?
Business Intelligence (BI) solutions have become increasingly popular as a tool for making better decisions and improving overall performance. These solutions allow businesses to gather and analyse data from various sources to gain insights into their operations and market trends.

However, investments in these solutions can be costly and it is not always straight-forward to determine KPIs which allow you to track the return these investments can deliver to your business. In this blog post we’ll explain some of the reasons why this can be challenging, as well as look at some ways to define and measure tangible and intangible benefits.
Define how you intend to measure
The first step in measuring ROI is to clearly align the intended outcomes you are aiming for. These could be:
- Improved decision-making
- Increasing revenue
- Reducing costs
- …
Once the business objectives are clear, the challenge is designing KPIs that allow you to monitor progress. In the case of increasing revenue, some KPIs could for example be “average revenue per customer” or “customer retention rate”. Similarly, the objective to reduce costs could be supported by the KPI “Customer Acquisition Cost”. Additionally, it is crucial to set a benchmark and a baseline for comparison.
By measuring KPIs aligned with your business objectives, you can improve the decision-making process which leads to better performance of your business.
No matter how badly you want to define crystal-clear metrics, the reality is that certain intangible benefits are simply hard to track. Operational efficiency and having integrated workflows that save your stakeholders and employees minutes (or hours) throughout the day are a good example of not easily being translated into a monetary value. Especially if we start accounting for the frustration and stress that might be alleviated due to your workforce having easy access to integrated information.
Our audience: the end-user
Often, BI project stakeholders do not sufficiently account for the operational reality. One of the critical factors that affect ROI of BI solutions is the level of adoption by end-users. End-users who are familiar with data and are comfortable with technology tend to achieve higher ROI than those who are not.
Users who can quickly find their way to BI reports and tooling, will spend less time looking for the data they need and more time focussing on the problem which requires the support of that data to begin with. Aside from data-maturity, easily accessible insights and sufficient training of users are what really drives adoption and operational efficiency.
In other words, governance is key
An example of operational efficiency and good governance
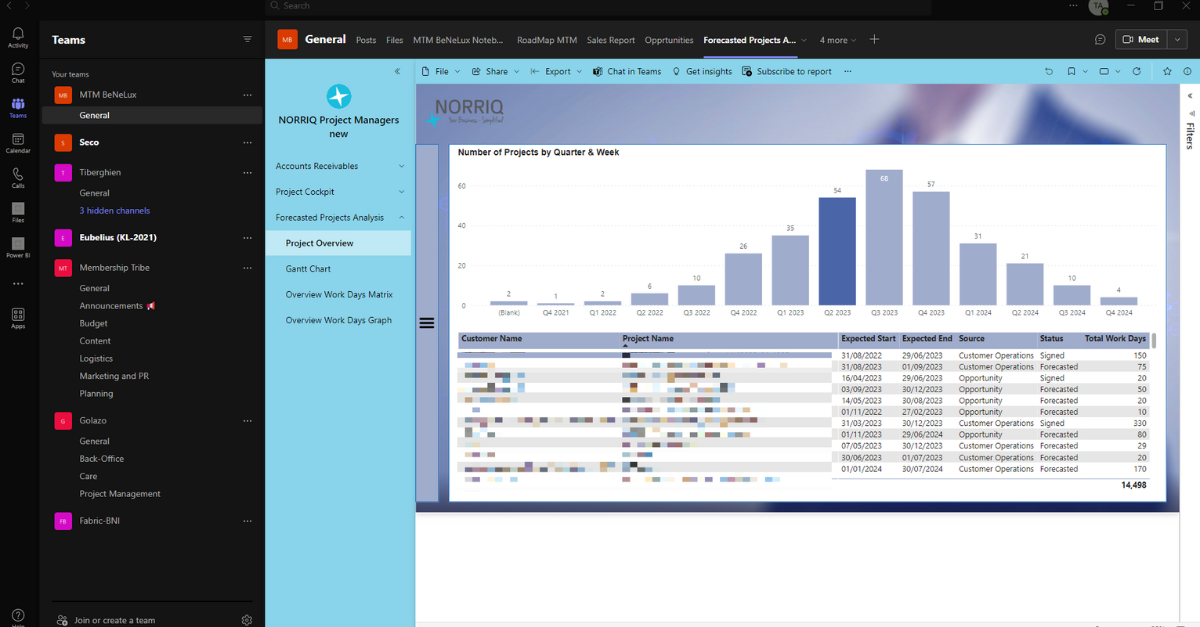
NORRIQ and the vendors have become quite proficient at integrating BI solutions into traditional workflows. For example, in our internal Management Team Meetings, we have chosen to add all the relevant dashboards and reports directly into our Microsoft Teams-environment.
Clearly, we all spend less time looking for the dashboards, switching between reports and wondering if our numbers are correct. We spend more time discussing our forecasted situation and related resource requirements.
Since this meeting typically has some of our more costly people in attendance, it makes sense to assume that optimizing the time of such meetings represents a significant cost-saving for us.
Data Quality: the elephant in the room
We do not question the data that we use – why? Data Quality!
During our own BI implementation cycle, we ensured being in close contact with the developers and the end-users to make sure that expectations were aligned, KPIs were defined clearly, correctly, and uniquely (eliminating conflicting definitions), and finally making sure that every single one of our users is aware of these definitions.
Additionally, we went through a process where we looked closely at the source data being supplied by our systems. Not only did this offer us the opportunity to mindfully assess our operational processes, but it also allowed us to identify certain gaps in data quality that previously went unnoticed.
Accurate and reliable data is the lifeblood of trusted BI solutions. Therefore, we had to ensure that it was clean, consistent, and up to date. We realised that the first step in our own BI journey was updating our governance policies:
- Data provisioning and updating
- Data Quality and consistency
- Integration of various sources of data
In the end, the Return on investment for our situation, can easily be summarized as:
- Operational improvement
- Evaluated and optimised our key business processes
- Better planning and forecasting, by having a clear view on the short and mid-term needs
- Faster decision making – because all of us understand where the data comes from and can trust that it is up to date.
Cover your risk
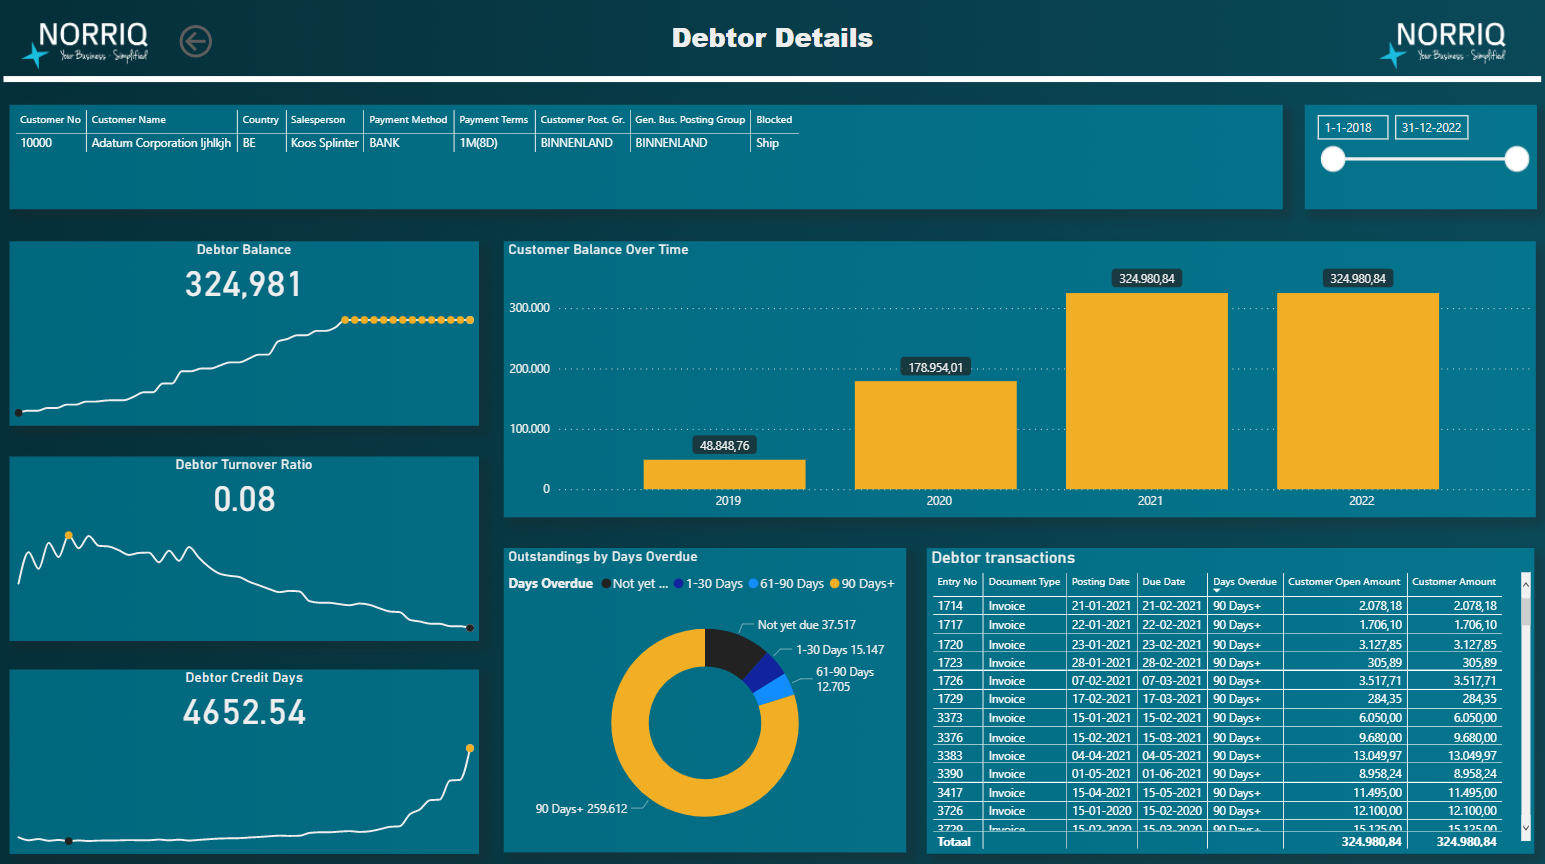
In some cases, BI solutions are not aimed at generating a direct tangible benefit. When thinking about ROI, it may be useful to turn the question on its head. Instead of asking “What benefit does this bring me?”, try posing the question: “What risk am I exposed to if I do not create visibility on problems X, Y and Z?” and subsequently “Is this risk significant enough to warrant investing to cover it?”.
BI solutions can be thought of as insurance policies to mitigate your foreseeable and unforeseeable risks. For example – not having a clear view on working capital and forecasted cash flow, could lead to badly timed investments, unexpected working capital reductions requiring short-term debt to bridge the gaps or missed opportunities due to falsely thinking that they are currently financially infeasible.
Start small and scale up
If the thought of expensive BI projects which do not live up to their potential remains frightening to you even after seeing the above approaches and best-practices, here’s another way to limit your exposure to the unknown: start small.
BI solutions no longer require massive investments and long implementation tracks. Today the concepts of low-code/no-code and self-service BI allow you to enter an agile continuous development cycle that gives you the opportunities to evaluate your road to adoption and your tangible benefits before moving forward in rolling out further developments and scaling up after establishing value.
In conclusion
BI is about setting measurable KPIs aligned with business objectives, allowing to track the performance of your solutions and make informed decisions to further improve your ROI. As such, the requirements and insights of the end-user are very important and should be considered in the context of good governance, data quality and integration. The success of a BI implementation project is heavily tied to the success of operational excellence and therefore you must evaluate each aspect critically, initiate tangible measurements where possible and be ready to kill your darlings.